
Metal Fatigue Characterization
Introduction
Metal fatigue is a phenomenon in which metal damage accumulates with repetitive loading-unloading, and eventually lead to fracture. There are numbers of major accidents that were caused by metal fatigue such as crash of Nikko jumbo jet, sodium leak in Monju Nuclear Power Plant, and many more. Safety design for metal fatigue is required for many structures such as automobiles, ships, airplanes, which are closely related to the daily-life.
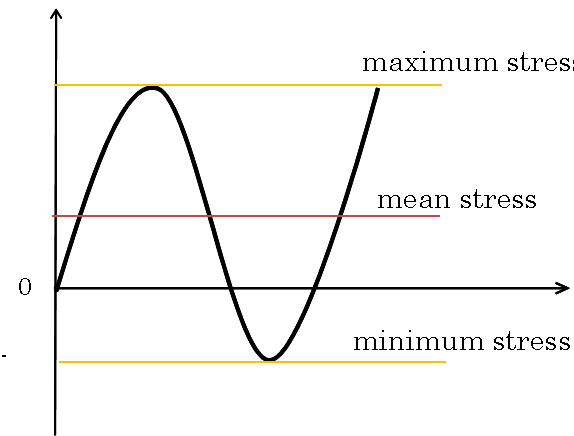
Structures are often used in an alternating fatigue environment where the tensile load and compressive load are asymmetric as shown in Fig. 2. In this case, due to the repetitive load, the structural material receives not only fatigue damage, but also repetitive creep damage. From the results of previous studies, it seems that there is a certain correlation between both damage, but details have not been clarified yet. Our group analyzes the data obtained by the fatigue test using an analysis method that is different from the conventional method to elucidate the correlation between fatigue damage and repetitive creep damage.
Experimental
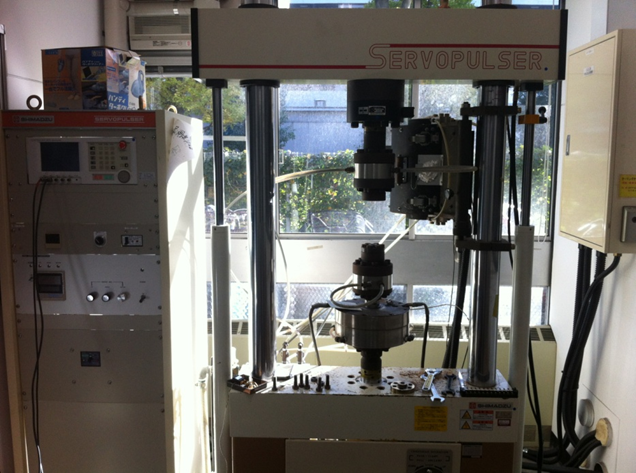
We used carbon steel S25C as the test material. The test specimen was treated at 850 °C for 45 min, and subsequently cooled in the furnace to form a microstructure consisted of ferrite and pearlite. A load-controlled fatigue test was performed by using Shimadzu high temperature atmospheric fatigue testing machine (EHF-EB 100 kNT-10L model) as shown in Fig. 3. The resulted strain of the test specimen were continuously measured. The test was carried out at room temperature atmosphere, the waveform was a sine wave, the frequency was 1 Hz, and the stress ratio was R=0.
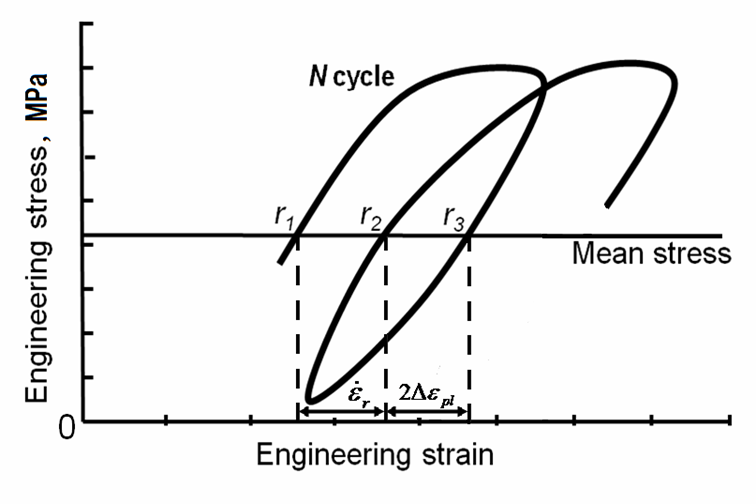
Hysteresis loop showing the relationship between stress and strain obtained from the fatigue test is shown in Fig. 4. Then, the plastic strain amplitude (Δε), which is the parameter of fatigue damage, and the creep rate (dεcr/dt) which is the parameter of repetitive creep damage, are respectively obtained.
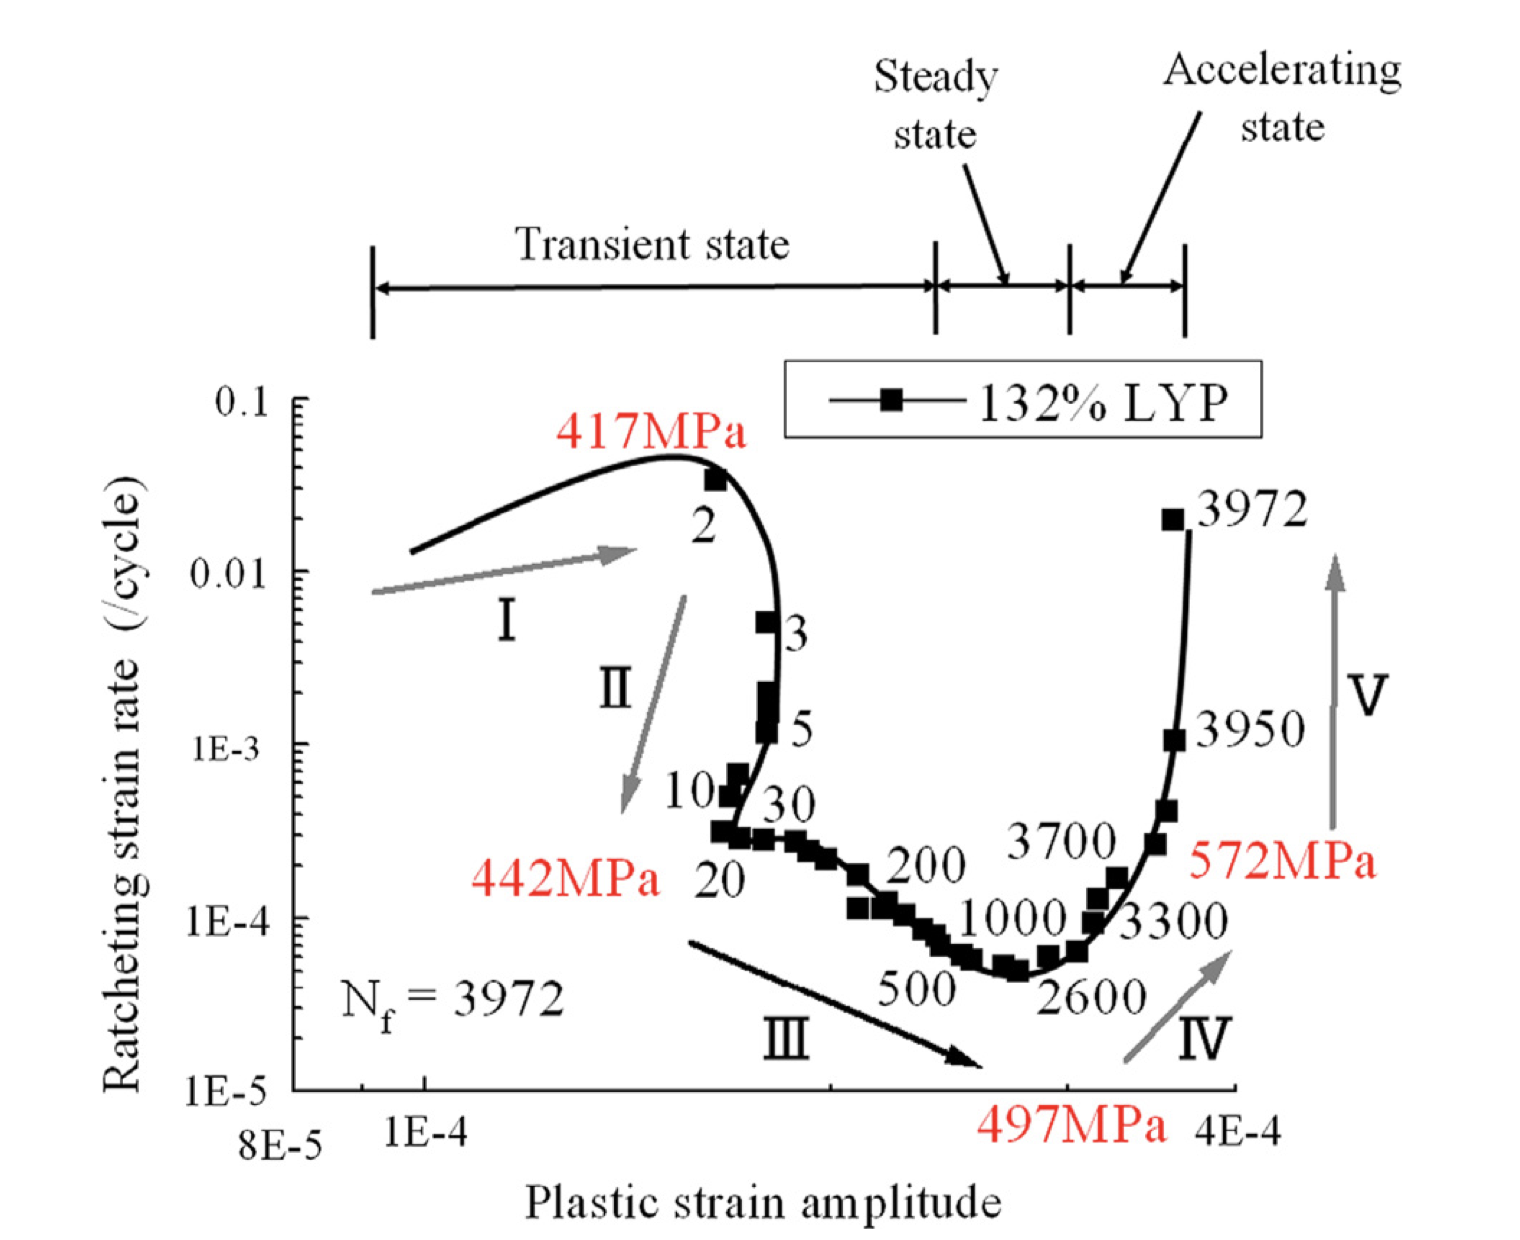
Conventionally, although fatigue damage and repetitive creep damage occurs simultaneously, the analysis of both damage was done separately and accordingly compared to each other. Our group attempts to elucidate the relationship of both damages which could not be grasped by the conventional analysis method by proposing a relationship between ratchetting rate (repetitive creep rate) on the vertical axes, and plastic strain amplitude on the horizontal axes. The resulting relationship curve is referred as SH curve, as an attribution to the late Prof. Susumu Horibe who firstly proposed this analysis method.
Results
The SH curve obtained from this study is shown in Fig. 5. The numbers in the figure represent the number of cycles, and it can be clearly seen that the relationship between the two changes with the progress of fatigue cycle. In the conventional analysis method, the fatigue progress can be divided into three stages, i.e. transition, steady-state, and accelerated, however, in this novel SH curve, it can be divided into five distinctive stages.
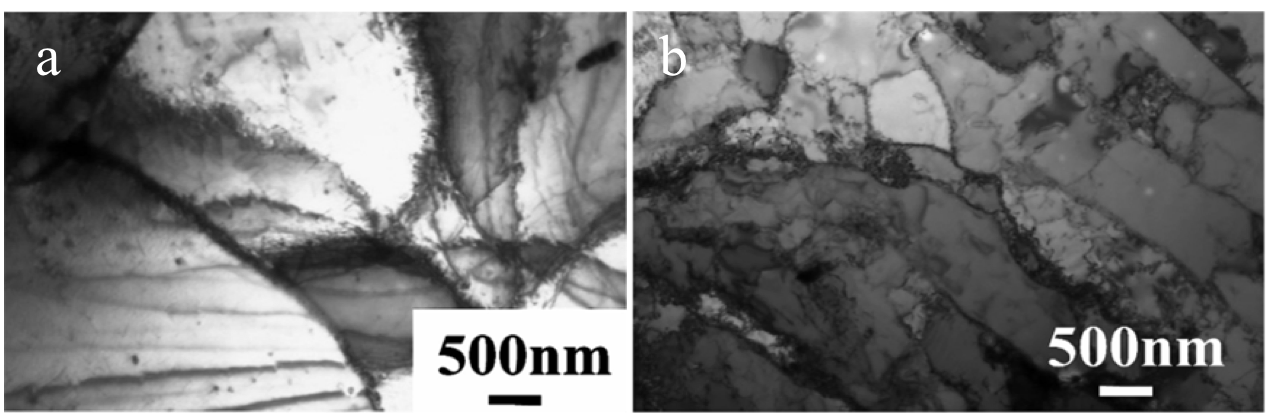
Microscopic structure in stages II and III was observed using transmission electron microscope (TEM), and shown in Fig. 6. It was found from Fig. 6(a) that the dislocation density was low, and complex dislocation structure such as dislocation cell and wall was not observed. In Fig. 6(b), it was found that the entire grains were occupied by dislocation cells.
By combining the results of these microscopic investigations and findings from previous studies, each stage may be described as follows:
- Stage I: Removal of dislocations from Cottrell atmosphere
- Stage II: Propagation of Luders deformation
- Stage III: Formation of dislocation cells by multiple slip system
- Stage IV: Collapse of dislocation cell due to the increase of true stress
- Stage V: Fatigue crack initiation and propagation
Conclusion
We proposed a new analytical method referred as SH curve to elucidate the correlation between fatigue damage and repetitive creep damage which could not be grasped by conventional analyzes. At present, the microscopic examination using TEM is only discussed at the stress ratio of R=0, thus, further detailed investigation is needed to understand the fatigue behavior under partially alternating stress (R≠0).
Publications
- Asato Hara, Rumi Kitazawa, Makoto Yoshida, Susumu Horibe: Material Science & Engineering A 590 (2014) 218-223
- Hiroyuki Shimano, M. Khairi Faiz, Asato Hara, Kyoko Yoshizumi, Makoto Yoshida, Susumu Horibe, Analysis of partially pulsating fatigue process on carbon steel with microstructural observation, Materials Science and Engineering A 651 (2016) 83-88